Costing & Reports
Costing decides what your stock is worth; the inventory reports tell you how much you hold, where, and how it moved. Together they tie your warehouse to your accounts — the valuation figure is the closing stock in your financial statements. This page works the numbers on our HDPE Granules — Grade A so you can see FIFO and weighted-average side by side, then covers landed cost and the two reports.
Costing methods
Raya values stock using one of three methods, set per item (or as a tenant default):
| Method | How the cost is set |
|---|---|
| Weighted average (default) | Every receipt blends into a running average cost across the on-hand quantity. |
| FIFO | First-in-first-out — issues draw from the oldest receipts first, so cost of goods follows the order stock came in. |
| Standard cost | A fixed cost per item, set on the item master; variances vs actual are tracked separately. |
Worked example — FIFO vs weighted average
We receive granules twice into Vatva WH-1, prices rising, then issue 60 MT to a drum work order:
| Event | Qty | Rate / MT | Value |
|---|---|---|---|
| Receipt 1 (batch HD-2405-A) | 50 MT | ₹95,000 | ₹47,50,000 |
| Receipt 2 (batch HD-2406-B) | 30 MT | ₹1,00,000 | ₹30,00,000 |
| On hand before issue | 80 MT | — | ₹77,50,000 |
| Issue to work order | −60 MT | see below | — |
FIFO
Issues consume the oldest stock first — all 50 MT of Receipt 1, then 10 MT of Receipt 2:
Cost of the 60 MT issue (COGS):
  50 MT × ₹95,000    = ₹47,50,000
  10 MT × ₹1,00,000  = ₹10,00,000
                      ------------
                       ₹57,50,000

Closing stock: 20 MT × ₹1,00,000 = ₹20,00,000
Weighted average
Every receipt blends into one running average, used for the issue and the remainder:
Average cost = ₹77,50,000 ÷ 80 MT = ₹96,875 / MT

Cost of the 60 MT issue (COGS): 60 × ₹96,875 = ₹58,12,500
Closing stock: 20 MT × ₹96,875           = ₹19,37,500
Why they differ
| FIFO | Weighted average | |
|---|---|---|
| COGS on the issue | ₹57,50,000 | ₹58,12,500 |
| Closing stock (20 MT) | ₹20,00,000 | ₹19,37,500 |
Same physical stock, different value. In a rising market FIFO leaves the newest (dearer) cost in stock, so closing stock is higher and COGS lower; weighted average sits in between. The two always reconcile to the same total once the item fully depletes.
:::caution Set the method before transacting An item's costing method should be chosen up front and left alone. Switching FIFO ↔ weighted average mid-life re-bases every open layer and makes period-on-period comparison unreliable. Pick one per item and stick with it. :::
Landed cost
The rate a receipt is valued at should be what the goods truly cost to get on the shelf — not just the supplier's line price. Landed cost spreads freight, duty and clearing across the received units. That is exactly how Receipt 2 above reached ₹1,00,000/MT:
Ex-works price   30 MT × ₹97,500      = ₹29,25,000
+ Freight                              =    ₹60,000
+ Clearing & handling                  =    ₹15,000
                                        -----------
Landed value                            ₹30,00,000
Landed cost per MT = ₹30,00,000 ÷ 30   = ₹1,00,000 / MT
The ₹75,000 of charges is apportioned by quantity (or value) onto the batch, so every downstream issue and the valuation report carry the true cost — see Import Purchase for duty and FX on foreign buys.
Stock valuation report
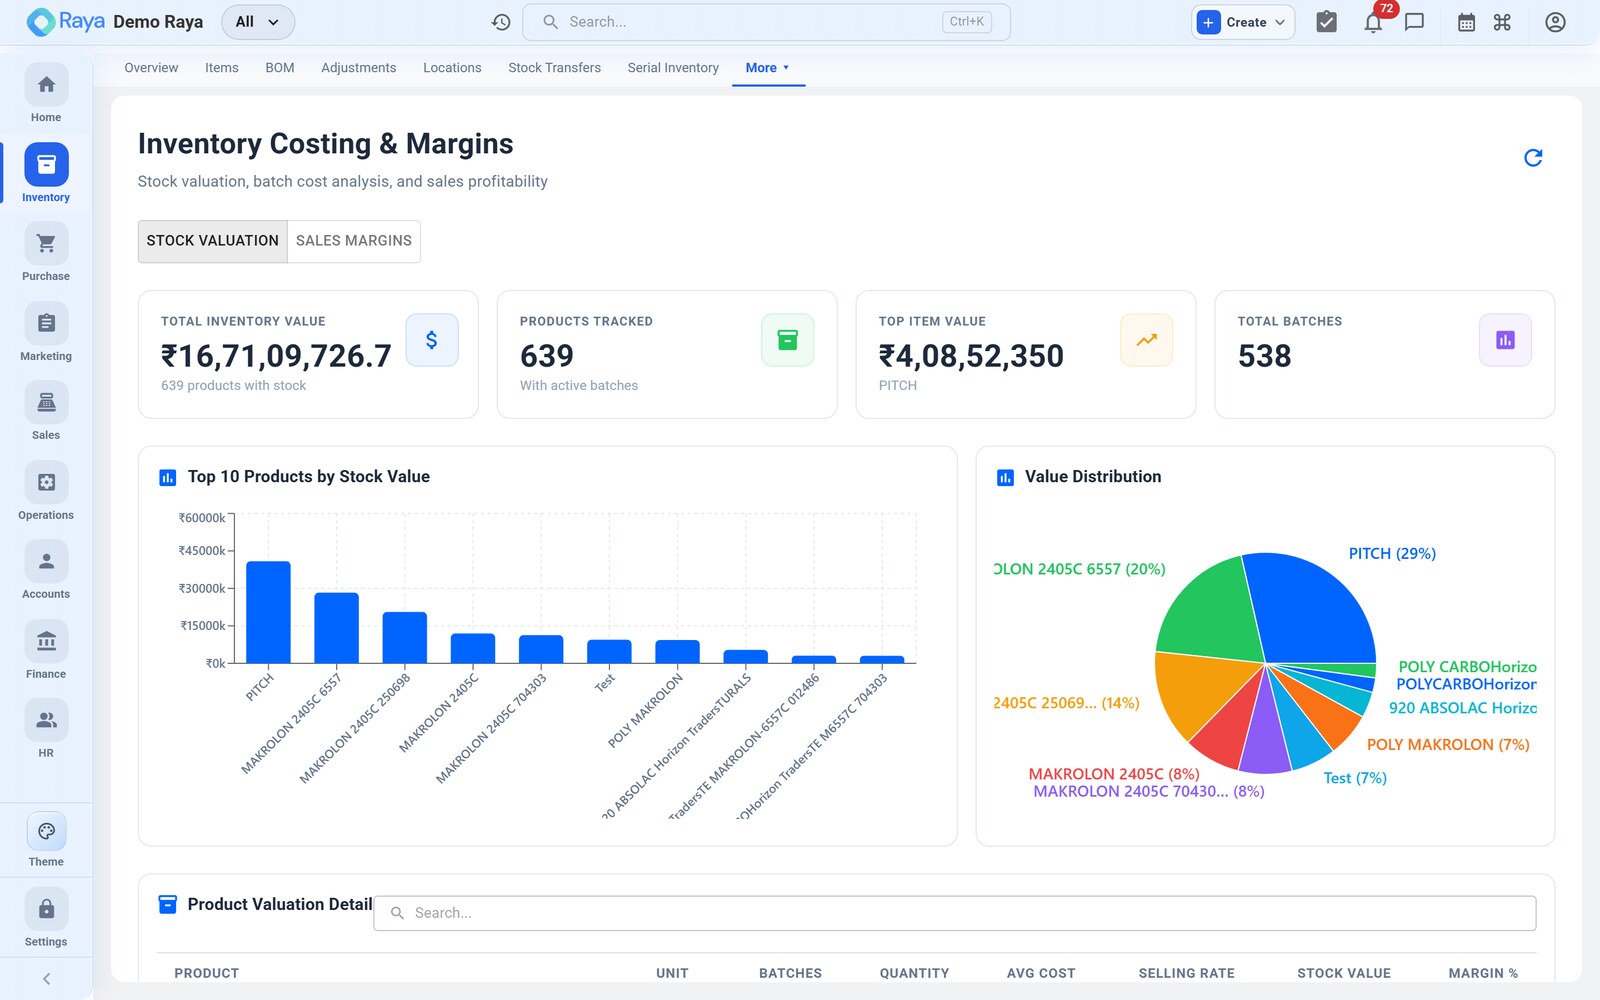
The stock valuation report shows the value of stock per location and a grand total, using each item's costing method:
| Location | Item | On hand | Cost/unit | Value |
|---|---|---|---|---|
| Vatva WH-1 | HDPE Granules — Grade A | 20 MT | ₹1,00,000 | ₹20,00,000 |
| Odhav Depot | HDPE Granules — Grade A | 8 MT | ₹95,000 | ₹7,60,000 |
| Vatva WH-1 | 50 L HDPE Drum | 485 Pc | ₹249.56 | ₹1,21,037 |
| Grand total | ₹28,81,037 |
:::note This figure ties to your books The grand total is the closing stock that appears in the P&L and balance sheet. Because it's built from the same posted stock ledger the movement report reads, the number always reconciles to the transactions behind it. :::
Stock movement report
The movement report (stock activity) is a complete audit trail — every change, in one place. Filter by item, location, date or transaction type. Raya records these types:
| Type | When it happens |
|---|---|
| Purchase Receipt | Goods received against a PO |
| Sales Shipment | Goods shipped against a sales order |
| Manufacturing Consumption | Components drawn by a work order |
| Manufacturing Output | Finished goods produced by a work order |
| Transfer In / Out | Stock moved between locations |
| Adjustment Increase / Decrease | Manual gain / loss with a reason code |
| Opening Balance | Initial stock loaded at onboarding |
Reading our granule's ledger back tells the whole story — two receipts, a transfer to Odhav, a work-order consumption, a damage write-off — each line stamped with its document, quantity, running balance and value.
Related
- Working with Items — cost, price and costing method live on the item.
- Bill of Materials — how consumed materials roll into product cost.
- Stock Adjustments — corrections that revalue stock.
- Stock Transfers — moves that appear in the movement report.